Wednesday, April 23, 2014

STRUCTURES EQUILIBRIUM METHOD

Cantilever beam with point load

Assume a beam of length L = 10 ft, supporting a load P = 2 k.  The beam bending moment and shear force may be computed, like the external reactions, by equations of equilibrium ΣH=0, ΣV= 0, and ΣM=0.  Bending moment and shear force cause bending-and shear stress, similar to axial load yielding axial stress f= P/A.

1      Cantilever beam with concentrated load
V     Shear diagram (shear force at any point along beam)
M    Bending moment diagram (bending moment at any point along beam)
∆     Deflection diagram (exaggerated for clarity) 

Reactions, found by equilibrium, ΣV=0 (up +) and ΣM=0 (clockwise +)


Shear V, found by vertical equilibrium, ΣV=0 (up +)


Left of a and right of b, shear is zero because there is no beam to resist it (reaction at b reduces shear to zero).  Shear may be checked, considering it starts and stops with zero. Concentrated loads or reactions change shear from left to right of them.  Without load between a and b (beam DL assumed negligible) shear is constant.

Bending moment M, found by moment equilibrium, ΣM=0 (clockwise +)


The mid-span moment being half the moment at b implies linear distribution.  The support reaction moment is equal and opposite to the beam moment. 

Deflection ∆ is described later.  Diagrams visualize positive and negative bending by concave and convex curvature, respectively.  They are drawn, visualizing a highly flexible beam, and may be used to verify bending.

STRUCTURES EQUILIBRIUM METHOD

Wednesday, April 16, 2014

Structures: Bending and Shear Stress

ending and shear stresses in beams relate to bending moment and shear force similar to the way axial stress relates to axial force (f = P/A).  Bending and shear stresses are derived here for a rectangular beam of homogeneous material (beam of constant property).  A general derivation follows later with the Flexure Formula.

Simple wood beam with hatched area and square marked for inquiry
2  Shear diagram with hatched area marked for inquiry
3  Bending moment diagram with hatched area marked for inquiry 
4  Partial beam of length x, with stress blocks for bending fb and shear fv, where x is assumed a differential (very small) length

Reactions, found by equilibrium ΣM = 0 (clockwise +)


Shear V, found by vertical equilibrium, ΣV=0 (upward +).


Bending moment M, found by equilibrium ΣM=0 (clockwise +) 


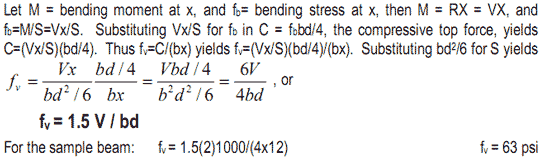
Bending stress fb is derived, referring to 4.  Bending is resisted by the force couple C-T,  with lever arm 2/3 d = distance between centroids of triangular stress blocks.  C=T= fb bd/4, M= C(2d/3) = (fbbd/4)(2d/3) = fbbd^2/6, or  fb= M/(bd^2/6); where bd^2/6 = S= Section Modulus for rectangular beam; thus


 * multiplying by 1000 converts kips to pounds, by 12 converts feet to inches. Shear stress fv is derived, referring to 4.  Bending stress blocks pushing and pulling in opposite directions create horizontal shear stress.  The maximum shear stress is fv=C/bx, where b = width and x = length of resisting shear plane.  Shear at left support is V = R.


Thursday, April 3, 2014

Structures: Bending Elements

Bending elements are very common in structures, most notably as beams.  Therefore, the theory of bending is also referred to as beam theory, not only because beams are the most common bending elements but their form is most convenient to derive and describe the theory.  For convenience, similar elements, such as joists and girders, are also considered beams.  Although they are different  in the order or hierarchy of structures,  their bending behavior is similar to that of beams, so is that of other bending elements, such as slabs, etc., shown on the next page. Thus, although the following description applies to the other bending elements, the beam analogy is used for convenience.

Beams are subject to load that acts usually perpendicular to the long axis but is carried in bending along the long axis to vertical supports.  Under gravity load beams are subject to bending moments that shorten the top in compression and elongate the bottom in tension. Most beams are also subject to shear, a sliding force, that acts both horizontally and vertically. Because beams and other bending elements are very common, the beam  theory is important in structural design and analysis.

As for other structural elements, beam investigation may involve analysis or design;  analysis, if a given beam is defined by architectural or other factors; design, if beam dimensions must be determined to support applied loads within allowable stress and deflection. Both, analysis and design, require to find the tributary load, reactions, shear, and bending moment.  In addition, analysis requires to find deflections, shear- and  bending stress, and verify if they meet allowable limits; by contrast design requires sizing  the beam, usually starting with an estimated size.

The following notations are commonly used for bending and shear stress:


Allowable stresses are given in building codes for various materials.

Allowable stresses assumed in this chapter are:


The more complex design and analysis of concrete and masonry will be introduces-later.

Friday, March 28, 2014

STABILITY OF STRUCTURES

Stability is more complex and in some manifestations more difficult to measure than  strength and stiffness but can be broadly defined as capacity to resist:

•  Displacement
•  Overturning 
•  Collapse
•  Buckling

Diagrams 1-3 give a theoretical definition;  all the other diagrams illustrate stability of conceptual structures.

1 Unstable
2 Neutral
3 Stable
4  Weak stability: high center of gravity, narrow base
5  Strong stability: low center of gravity, broad base
6  Unstable post and beam portal
7   Stable moment frame
8  Unstable T-frame with pin joint at base
9  Stable twin T-frames


Buckling stability 

Buckling stability is more complex to measure than strength and stiffness and largely based on empirical test data.. This introduction of buckling stability is intended to give only a qualitative intuitive understanding.

Column buckling is defined as function of slenderness and beam buckling as function of  compactness.  A formula for column buckling was first defined in the 18th century by Swiss mathematician Leonhard Euler.  Today column buckling is largely based on empirical tests which confirmed Euler’s theory for slender columns; though short and stubby columns may crush due to lack of compressive strength.

Beam buckling is based on empirical test defined by compactness, a quality similar to column slenderness.

1  Slender column buckles in direction of least dimension
2  Square column resist buckling equally in both directions
3  Blocking resists buckling about least dimension
4  Long and slender wood joist subject to buckling
5  blocking resists buckling of wood joist
6  Web buckling of steel beam
7  Stiffener plates resist web buckling

A  Blocking of wood stud
B  Blocking of wood joist
C  Stiffener plate welded to web
P Load


Wednesday, March 19, 2014

Buildings: Thermal examples

1 Curtain wall
Assume: 

Aluminum curtain wall, find required expansion joint


Thermal strain


2  High-rise building, differential expansion
Assume:

Steel columns exposed to outside temperature


Differential expansion


3  Masonry expansion joints 
(masonry expansion joints should be at maximum L = 100’)
Assume

Buildings: Thermal examples

Tuesday, March 11, 2014

STRUCTURES - STRAIN EXAMPLES

1 Elevator cables
Assume 
Elongation under load
2 Suspended building
3 Differential strain
Assume

4 Shorten hangers under DL to reduce differential strain, or prestress strands to reduce ∆L by half


Note: Differential strain is additive since both strains are downwards
To limit differential strain, suspended buildings have <= 10 stories / stack

STRUCTURES - STRAIN EXAMPLES

Thursday, March 6, 2014

STRUCTURES - PRINCIPLE STRESS

Shear stress in one direction, at 45 degrees acts as tensile and compressive stress, defined as principle stress.  Shear stress is zero in the direction of principle stress, where the normal stress is maximum.  At any direction between maximum principle stress and maximum shear stress, there is a combination of shear stress and normal stress.  The magnitude of shear and principle stress is sometimes required for design of details.  Professor Otto Mohr of Dresden University develop 1895 a graphic method to define the  relationships between shear stress and principle stress, named Mohr’s Circle.  Mohr’s circle is derived in books on mechanics (Popov, 1968).


Isostatic lines

Isostatic lines define the directions of principal stress to visualize the stress trajectories in beams and other elements.  Isostatic lines can be defined by experimentally by photo-elastic model simulation or graphically by Mohr’s circle.

1  Simple beam with a square marked for investigation
2  Free-body of square marked on beam with shear stress arrows
3  Free-body square with shear arrows divided into pairs of equal effect
4  Free-body square with principal stress arrows (resultant shear stress vectors)
Free-body square rotated 45 degrees in direction of principal stress
6  Beam with isostatic lines (thick compression lines and thin tension lines)

Note:

Under gravity load beam shear increases from zero at mid-span to maximum at supports. Beam compression and tension, caused by bending stress, increase from zero at both supports to maximum at mid-span.  The isostatic lines reflect this stress pattern; vertical orientation dominated by shear at both supports and horizontal orientation dominated by normal stress at mid-span.  Isostaic lines appear as approximate tension “cables” and compression “arches”.

Tuesday, February 25, 2014

STRUCTURES: TORSION

Torsion is very common in machines but less common in building structures.  The examples here include a small detail and an entire garage.

1 Door handle 


2 Tuck-under parking


Note: The torsion moment is the product of base shear v and lever arm e, the distance from  center of mass to center of resistance (rear shear wall). In the past, torsion of tuck-under parking was assumed to be resisted by cross shear walls.  However, since the Northridge Earthquake of 1994 where several buildings with tuck-under parking collapsed, such buildings are designed with moment resistant  beam/column joints at the open rear side.

STRUCTURES: TORSION

Tuesday, February 18, 2014

STRUCTURES: SHEAR STRESS

Shear stress occurs in many situations, including the following examples, but also in  conjunction with bending, described in the next chapter on bending.  Shear stress  develops as a resistance to sliding of adjacent parts or fibers, as shown on the following  examples.  Depending on the number of shear planes (the joining surface [A] of connected elements) shear is defined as single shear or double shear.

A Shear plane
B Shear crack


STRUCTURES: SHEAR STRESS

Tuesday, February 11, 2014

STRUCTURES: AXIAL STRESS

Axial stress acts in the axis of members, such as columns.  Axial tension is common in rods and cables; wile axial compression is common in walls and columns.  The following  examples illustrates axial design and analysis.  Analysis determines if an element is ok;  design defines the required size.  The equation, fa = P/A, is used for analysis.  The  equation A = P/Fa, is used for design.  Allowable stress, Fa, includes a factor of safety.

1  Crane cable design 


2  Suspension hanger analysis (Hong Kong-Shanghai bank) 


3 Post/footing analysis 


4  Slab/wall/footing, analyze a 1’ wide strip

STRUCTURES: AXIAL STRESS

Wednesday, January 29, 2014

STRUCTURES: FORCE VS. STRESS

Force and stress refer to the same phenomena, but with different meanings.  Force is an external action, measured in absolute units: # (pound), k (kip); or SI units: N (Newton),  kN (kilo Newton).  Stress is an internal reaction in relative units (force/area ), measured in psi (pound per square inch), ksi (kip per square  inch); or SI units: Pa (Pascal), kPa (kilo Pascal).  Axial stress is computed as:

f = P / A

where

 f = stress
 P = force
 A = cross section area

Note: stress can be compared to allowable stress of a given material.

Force is the load or action on a member
•  Stress can be compared to allowable stress for any material, expressed as:
 F ≥ f  (Allowable stress must be equal or greater than actual stress)

where

  F = allowable stress
  f = actual stress

The type of stress is usually defined by subscript:

 Fa, fa   (axial stress, capital F = allowable stress)
 Fb, fb   (bending stress, capital F = allowable stress)
 Fv, fv   (shear stress, capital F = allowable stress)

The following examples of axial stress demonstrate force and stress relations:


Note:  The heel would sink into the wood, yield it and mark an indentation

STRUCTURES: FORCE VS. STRESS

Wednesday, January 22, 2014

STRUCTURES - FORCE TYPES

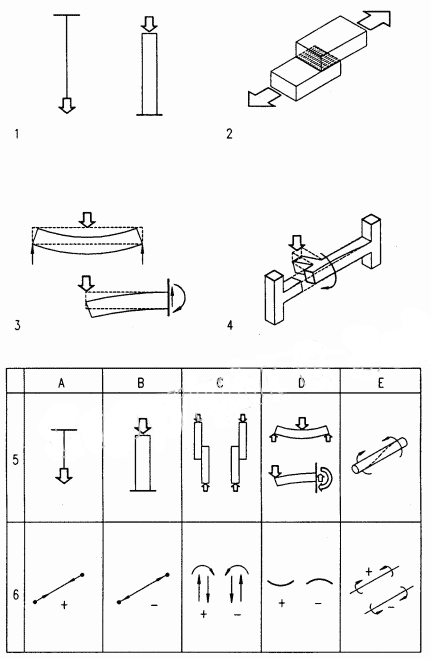
Forces on structures include tension, compression, shear, bending, and torsion.  Their  effects and notations are tabulated below and all but bending and related shear are  described on the following pages.  Bending and related shear are more complex and further described in the next part.


1  Axial force (tension and compression)
2 Shear
3 Bending
4 Torsion
5 Force actions
6  Symbols and notations

A Tension
B Compression
C Shear
D Bending
E Torsion

STRUCTURES - FORCE TYPES

Monday, January 13, 2014

STRUCTURES - SUSPENSION ROOF

Assume:


1  Cable roof structure

2  Parabolic cable by graphic method

 Process:
  Draw AB and AC (tangents of cable at supports)
  Divide tangents AB and AC into equal segments
  Lines connecting AB to AC define parabolic cable envelop

3 Cable profile

 Process:
  Define desired cable sag f (usually f = L/10)
  Define point A at 2f below midpoint of line BC
  AB and AC are tangents of parabolic cable at supports
  Compute total load W = w L

4  Equilibrium vector polygon at supports (force scale: 1” = 50 k)
 Process:
  Draw vertical vector (total load W)
  Draw equilibrium polygon W-Tl-Tr
  Draw equilibrium polygons at left support Tl-H-Rl
  Draw equilibrium polygons at right support Tr-Rr-H
  Measure vectors H, Rl, Rr at force scale

Note:  This powerful method finds five unknowns: H, RI, Rr. Tl. Tr The maximum cable force is at the highest support


Sunday, January 5, 2014

DESIGN FUNICULAR STRUCTURES

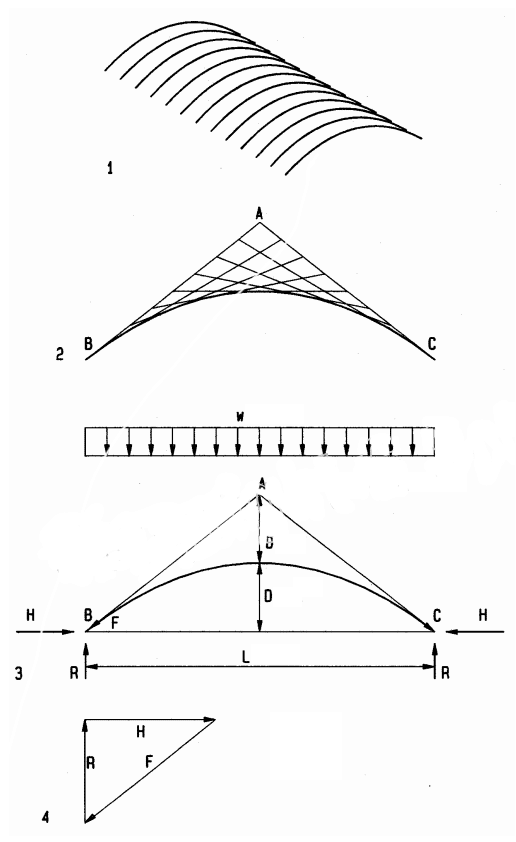
Graphic vector are powerful means to design funicular structures, like arches and  suspension roofs; providing both form and forces under uniform and random loads. 

Arch  
Assume:


1 Arch structure


2  Parabolic arch by graphic method

Process:
  Draw AB and AC (tangents of arch at supports)
  Divide tangents AB and AC into equal segments
  Lines connecting AB to AC define parabolic arch envelope 

3 Arch profile 

Process:
  Define desired arch rise D (usually D = L/5)
  Define point A at 2D above supports
  AB and AC are tangents of parabolic arch at supports
  Compute vertical reactions R = w L /2 

4  Equilibrium vector polygon at supports (force scale: 1” = 50 k)  Process:

  Draw vertical vector (reaction R)
  Complete vector polygon (diagonal vector parallel to tangent)
  Measure vectors (H = horizontal reaction, F = max. arch force)

Note:

The arch force varies from minimum at crown (equal to horizontal reaction), gradually increasing with arch slope, to maximum at the supports.

Monday, December 23, 2013

TRUSS EXAMPLE

Some trusses have bars with zero force under certain loads.  The example here has zero force in bars HG, LM, and PG under the given  load.  Under asymmetrical loads these bars would not be zero and, therefore, cannot be eliminated.  Bars with zero force have  vectors of zero length in the equilibrium polygon and, therefore, have both letters at the  same location.  

Tension and compression in truss bars can be visually verified by deformed shape (4),  exaggerated for clarity.  Bars in tension will elongate; bars in compression will shorten.  

In the truss illustrated the top chord is in compression; the bottom chord is in tension;  inward sloping diagonal bars in tension; outward sloping diagonal bars in compression.

Since diagonal bars are the longest and, therefore, more likely subject to buckling, they  are best oriented as tension bars.

1 Truss diagram
2 Force polygon
3  Tabulated bar forces (+ implies tension, - compression)
4  Deformed truss to visualize tension and compression bars
A  Bar elongation causes tension
B  Bar shortening causes compression

Tuesday, December 17, 2013

STRUCTURES - TRUSS ANALYSIS

Graphic truss analysis (Bow’s Notation) is a method to find bar forces using graphic vectors as in the following steps:

A  Draw a truss scaled as large as possible (1) and compute the reactions as for beams (by moment method for asymmetrical trusses).
 
B  Letter the spaces between loads, reactions, and truss bars.  Name bars by adjacent letters: bar BH between B and H, etc.
 
C  Draw a force polygon for external loads  and reactions in a force scale, such as  1”=10 pounds (2).  Use a large scale for accuracy.  A closed polygon with head-to-tail arrows implies equilibrium.  Offset the reactions to the right for clarity.
 
Draw polygons for each joint to find forces in connected bars.  Closed polygons
with head-to-tail arrows are in equilibrium.  Start with left joint ABHG.  Draw a
vector parallel to bar BH   through B in the polygon.  H is along BH.  Draw a vector
parallel to bar HG through G to find H at intersection BH-HG.
 
E  Measure the bar forces as vector length in the polygon.
 
F  Find bar tension and compression.  Start with direction of   load  AB  and  follow  polygon ABHGA with head-to-tail arrows.  Transpose arrows to respective bars in  the truss next to the joint.  Arrows pushing toward the joint are in compression; arrows pulling away are in tension.  Since the arrows reverse for adjacent joints,  draw them only on the truss but not on the polygon.

G  Draw equilibrium arrows on opposite bar ends; then proceed to the next joint with  two unknown bar forces or less (3).  Draw polygons for all joints (4), starting with  known loads or bars (for symmetrical  trusses half analysis is needed).

1 Truss diagram
2  Force polygon for loads, reactions, and the first joint polygon
3  Truss with completed tension and compression arrows
4  Completed force polygon for left half of truss
5  Tabulated bar forces (- implies compression)

STRUCTURES - TRUSS ANALYSIS

Monday, December 9, 2013

STRUCTURES VECTOR ANALYSIS

First used by Leonardo da Vinci, graphic vector analysis is a powerful method to analyze  and visualize the flow of forces through a structure.  However, the use of this method is restricted to statically determinate systems.  In addition to forces, vectors may represent  displacement, velocity, etc.  Though only two-dimensional forces are described here, vectors may represent forces in three-dimensional space as well.  Vectors are defined by  magnitude, line of action, and direction, represented by a straight line with an arrow and  defined as follows:

Magnitude is the vector length in a force scale, like 1” =10 k or 1 cm=50 kN
Line of Action is the vector slope and location in space
Direction is defined by an arrow pointing in the direction of action

1  Two force vectors P1 and P2 acting on a body pull in a certain direction.  The resultant R is a force with the same results as P1 and P2 combined, pulling in the  same general direction.  The resultant is found by drawing a force parallelogram [A]  or a force triangle [B].  Lines in the vector triangle must be parallel to corresponding  lines in the  vector plan [A].  The line of action of the resultant is at the intersection  of P1 / P2 in the vector plan [A].  Since most structures must be at rest it is more  useful to find the  equilibriant E that puts a set of forces in equilibrium [C].  The  equilibriant is equal in magnitude but opposite in direction to the resultant.  The  equilibriant closes a force triangle with all vectors connected head-to-tail.  The line  of action of the equilibriant is also at the intersection of P1/P2 in the vector plan [A].

2  The equilibriant of three forces [D] is found, combining interim resultant R1-2 of  forces P1 and P2 with P3 [E].  This process may be repeated for any number of  forces.  The interim resultants help to clarify the process but are not required [F].  The line of action of the equilibriant  is located at the intersection of all forces in the  vector plan [D].  Finding the equilibriant for any number of forces may be stated as  follows:

The equilibriant closes a force polygon with all forces connected head-to-tail,  and puts them in equilibrium in the force plan.

3  The equilibriant of forces without a common cross-point [G] is found in stages:   First the interim resultant R1-2 of P1 and P2 is found [H] and located at the  intersection of P1/P2 in the vector plan [G].  P3 is then combined with R1-2 to find  the equilibriant for all three forces, located at the intersection of  R1-2 with P3 in the  vector plan.  The process is repeated for any number of forces.

 STRUCTURES VECTOR ANALYSIS

Monday, December 2, 2013

STRUCTURES - BEAM REACTIONS

To find reactions for asymmetrical beams:

•  Draw an abstract beam diagram to illustrate computations
•  Use Σ M = 0 at one support to find reaction at other support
•  Verify results for vertical equilibrium


1 Floor framing
2  Abstract beam diagram

Support reactions:


Alternate method (use uniform load directly)


1  Simple beam with point loads


2  Beam with overhang and point loads 


3  Beam with uniform load and point load (wall)